The price outlook for LTC, XLM, and UNI heading into the weekend suggests bears are still in control.
As of writing, the market is largely in red, with only Stellar (XLM) +4.22% and Binance Coin (BNB) +2.66% trending green among the top 20 cryptocurrencies by market cap. Most of the other assets are losing 1.5%-7% over the past 24 hours, and nearly in double-digits for all over the past week.
Here’s how the technical picture looks for LTC, XLM, and UNI heading into the weekend.
Litecoin price
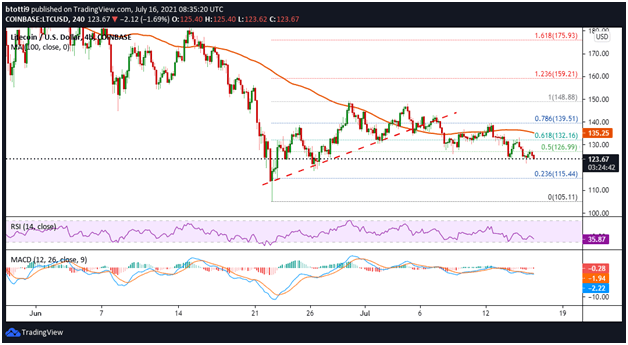
Litecoin has dropped below $125, extending the decline after bulls failed to hold the $130 support zone. The bearish flip followed a breakdown below a critical trendline with support near $139.
The MACD and RSI technical indicators are in the bearish zones.
As seen on the 4-hour chart, LTC/USD has moved away from the 100-day simple moving average, suggesting the pair could see fresh sell-off pressure. If that happens, LTC price could seek support at $115-$105 in the near term.
Key levels to watch therefore are the 50% Fib and 23.6% Fib retracement levels as highlighted in the chart.
 LTC/USD 4-hour chart. Source: TradingView
Stellar price
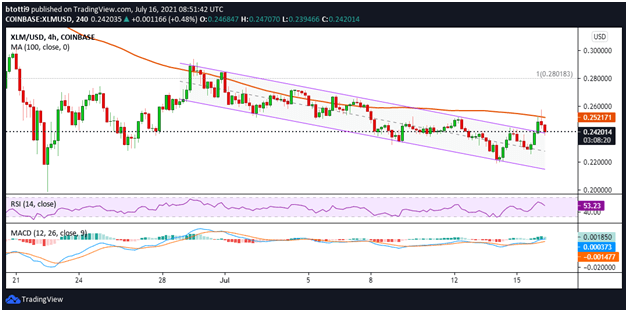
Stellar price is up 4.22% in the past 24 hours to trade around $0.24 against the US dollar. The upside to the current price levels is however facing short-term pressure as a breakout from a descending channel has faded over the last two sessions.
The MACD and RSI however suggest bulls have the upper hand, with the latter above the 50-mark level. The MACD line is trending bullish above the signal line. If bulls keep prices above $0.24, the next hurdle would be the 100 SMA ($0.25) and further gains could occur towards a key resistance line near $0.269 and then $0.288.
On the downside, the key levels to watch are at the horizontal line at $0.235 and $0.21.
 XLM/USD 4-hour chart. Source: TradingView
Uniswap price
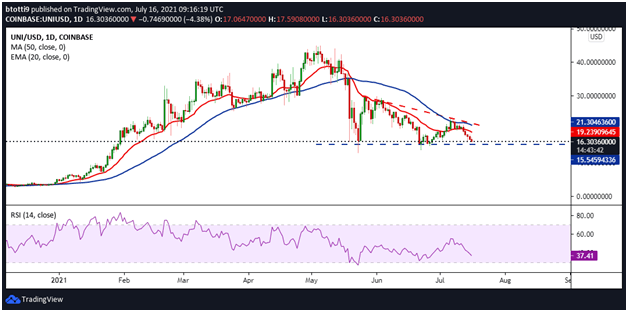
Uniswap (UNI) price has broken below the 50-day moving average ($21.30) and the 20-day EMA ($19.25). The technical picture for UNI/USD suggests that the path downwards is more likely, with the SMA and EMA curves sloping.
The RSI on the 4-hour chart is trending towards the oversold territory, with the bears likely to retain a stranglehold in the near term if the negative divergence continues.
 UNI/USD daily chart. Source: TradingView
On the upside, bulls face barriers at $20.22 and $25.18. However, if prices break below $15.50, it could confirm a descending triangle pattern formation. In case this happens, UNI/USD could start a fresh decline and retest prices around $13.22 and $9.50


 English (US) ·