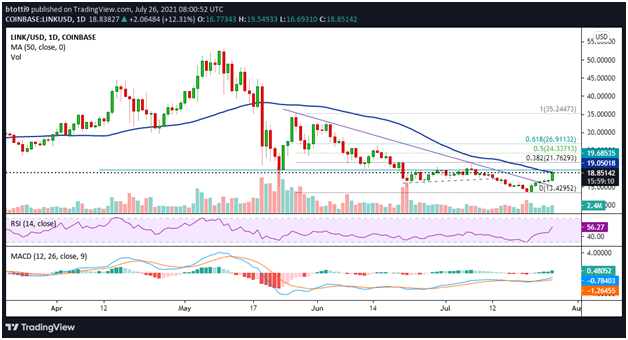
LINK/USD is above a critical trendline, and could target highs of $35 for the weekly close.
Chainlink’s price is up 13% in the past 24 hours, and 23% over the past week, to see bulls eye a fresh breakout above $20. The 14th ranked cryptocurrency has a trading volume of $1.2 billion in the 24-hour session and currently changes hands near $19.10 after increased buying buoyed by a resurgent crypto market.
As the entire market looks to break above a descending trend line formed since May, LINK buyers could take advantage to close above $20 and target highs last seen on 20 June.
The short-term outlook for LINK/USD, therefore, depends on how the cryptocurrency and the rest of the market navigate the current response from sellers.
Chainlink price analysis
Chainlink's integration on the Avalanche blockchain coincided with an uptick in LINK price, although the weekend began with indecision as shown by the long tail on Friday's candlestick.
The indecision resolved upwards over the weekend and continued in early deals on Monday.
As of writing, LINK's price is just above the 50-day moving average ($19.05) after breaking above a bearish trendline that has capped prices since late May as seen on the daily chart.
This comes amid reduced selling pressure, which has helped bulls advance above the trendline to an intraday of $19.54. Validation of the uptrend could see LINK/USD search for new support near the horizontal resistance at $19.68 and lay the foundation for a fresh assault at prices above $20.

LINK/USD daily chart. Source: TradingView
Technical indicators support the immediate bullish outlook, with the Relative Strength Index (RSI) ticking up above the 50-mark. The upturned RSI suggests buyers still have the market in upbeat sentiment, which is also strengthened by the Moving Average Convergence Divergence (MACD). Currently, the MACD has formed a bullish crossover and is increasing above the signal line.
If bulls manage to break above $20, targets lie north of the 50% Fibonacci retracement level and the 61.8% Fibonacci retracement level at $24.33 and $26.91 respectively. The weekly gains could then extend to $35 if bulls hold onto gains.
On the downside, selling pressure could force buyers to defend gains around $18 on the daily close. Support levels are at $16.79 and $13.42 in case the current rally lacks legs.


 English (US) ·