The price of LINK is down 4.5% in the past 24 hours and remains over 10% in the red this past week.
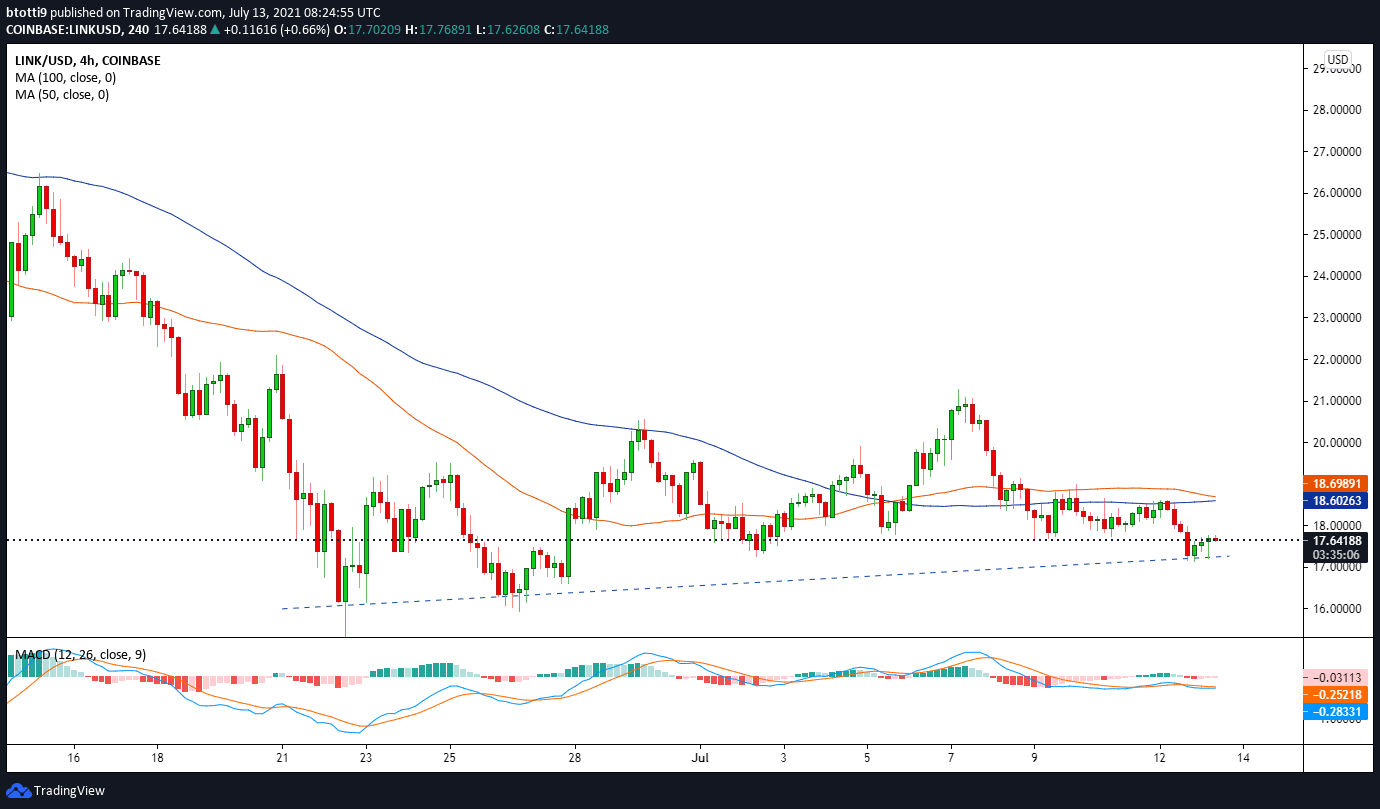
Chainlink (LINK) trading just above a major horizontal line that has kept prices afloat since 22 June. At its current price of $17.62, LINK is looking to extend some hourly gains that have seen it move away from intraday lows of $17.13.
As such, buyers might continue to push higher. However, the latest dip might welcome fresh downward pressure to leave bulls and bears struggling to retake control.
This might see LINK/USD remain ranged below the 50-day and 100-day simple moving averages, with any breakdown likely to drag prices to recent support levels as shown in the chart below.
Chainlink price outlook
The 4-hour chart shows that the Relative Strength Index (RSI) is below the equilibrium mark. It’s slightly upturned but still trends below a negative line to suggest bears are in control. The MACD is also pointing to bearish control after a crossover below the signal line, indicating that prices are likely to struggle for an upside from current levels.
The immediate outlook then is likely to see bulls consolidate gains to protect from bears who might want to capitalise on the indecision in the broader market.
For LINK/USD, another bout of sideways action in the next few days looks more likely. Expect prices to range between $16.00 (previous horizontal support level) and $18.80. The latter price zone is just above the 100 SMA ($18.59) and 50 SMA ($18.72), which are likely to provide the next major resistance zone if bulls breach the $18.00 hurdle.
But above this, Chainlink’s price could test resistance at $20.00, with the 7-day high ($21.23) and 30-day high ($26.44) as the next targets.
 LINK/USD 4-hour price chart. Source: TradingView
If bulls fail to break the mentioned barriers, a breakdown from the initial resistance at $18.00 could invite more pressure.
In this case, LINK/USD could drop to its primary support level near $17.20 where we have a bullish trendline. The next support levels could be at $16.75 and $16.00.


 English (US) ·