Sell-off pressure for much of the summer has seen Bitcoin’s price trade lower, with today’s 24-hour low being $31,660
BTC/USD has touched prices near $31,800 for the time since 26 June, which is when the benchmark cryptocurrency began its recovery from monthly lows of $30,082.
As of writing, Bitcoin is changing hands at $31,886 as bulls try to stop further declines that could threaten a breakdown to last month’s lows. Bitcoin is down 3.7% and nearly 10% over the past 24 hours and week respectively.
Yet, PAC coin CEO David Gokhshstein says this correction is what the market needs and provides the stage for Bitcoin to start a new leg to $80k.
According to on-chain data tracking platform Ecoinometrics, prices near $30k have provided a “reset” for BTC and the accumulation being seen means that the only way from these price levels will be up.
Since #BTC stabilized around $30k things have changed though.
Whales and small fish have started accumulating again while other categories have turned neutral. (11/13) pic.twitter.com/CkJjQn6ayk
— ecoinometrics (@ecoinometrics) July 13, 2021
Why BTC could see more dips
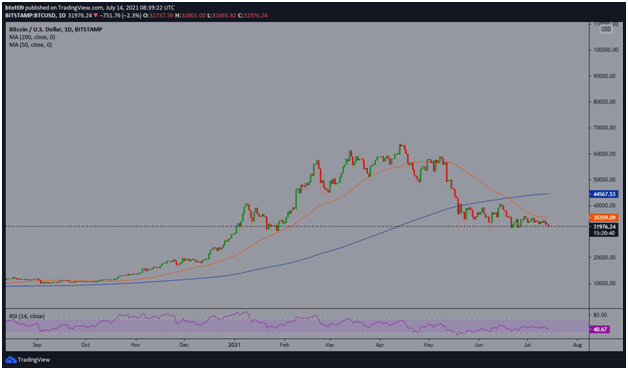
The BTC/USD pair is at risk of fresh losses given its price is currently suppressed after a recent death cross pattern. In June, BTC formed a death cross when the 50-day moving average crossed below the 200-day moving average.
Prices have traded in a descending symmetrical triangle since and Bitcoin could see more selling pressure if it dips below $31,600. The daily RSI indicates this is likely given bears are in control.
 BTC/USD daily chart. Source: TradingView
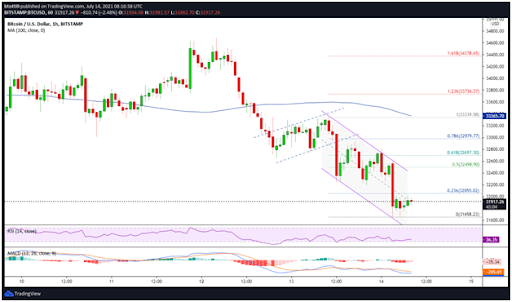
On the hourly chart, Bitcoin tanked over 5% to confirm the continuation of the bearish flag pattern. The outlook from this pattern’s expected resolution is threatening further rot. The chart shows a descending parallel channel, which could strengthen the negative picture.
The 3.7% dip seen over the past 24 hours has extended Bitcoin’s decline below the 100-hourly simple moving average, touching lows of $31,660.
The sloping curve of the 100-hourly SMA, an RSI below 50, and a bearish MACD suggest that the path of least resistance is downwards.
The immediate picture could thus see prices settling into sideways trading within the declining channel. On the contrary, a breakdown below the channel’s support could put BTC on course for a retest of prices near $30,000.
 BTC/USD hourly chart. Source: TradingView
On the upside, bulls are attempting to break above the middle line of the channel. Success means they could test bears at the 23.6% Fibonacci retracement level ($32,025). If buyers succeed in breaking higher, they could target the 50% Fib resistance level ($32,498)—also near the upper trendline of the declining channel.
There’s been a lot of FUD around Bitcoin, especially from China’s move to shut down mining farms in the country. Also, the leading cryptocurrency exchange Binance has found itself in the crosshairs of several regulatory agencies to add to the negative sentiment.


 English (US) ·